Research
Crypto Factor Model Analysis
A data-driven look at how beta, size, value, and momentum systematically drive crypto returns.

Mario Stefanidis
November 14, 2025
A data-driven look at how beta, size, value, and momentum systematically drive crypto returns.
.avif)
Crypto exhibits persistent style premia, just like equities.
By constructing four systematic factors (Market Risk, Size, Value, Momentum) across eligible tokens, we find:
Together, these factors explain ~55% of individual token returns and ~75% of diversified portfolio returns.
The purpose of this study is to determine whether persistent style premia, such as those long observed in equities, also manifest in crypto markets. We test if systematic exposures such as market beta, size, valuation multiples, and trend persistence can explain cross-sectional variation in token returns.
To learn more about our methodology, request detailed testing results, or explore commercial opportunities, please reach out to the Artemis team.
Constructed 4 time-series factors: Market Risk, Size, Value, and Momentum. Portfolios are rebalanced weekly using simple USD returns for factor construction and performance, with start date varying depending on threshold for minimum token inclusion. Correlation and regression utilize log returns.
Data is sourced from Artemis Analytics with the exception of equity index data which is sourced from Yahoo Finance.
Returns are gross of transaction costs; realized performance would depend on execution costs and liquidity at the time of trade.
Broad Eligibility Criteria:
All factor portfolio’s were constructed from eligible assets at each time period per the criteria below:
These thresholds balance breadth and data quality, excluding illiquid and microcap tokens whose volatility would distort factor returns.
Captures broad crypto market exposure.
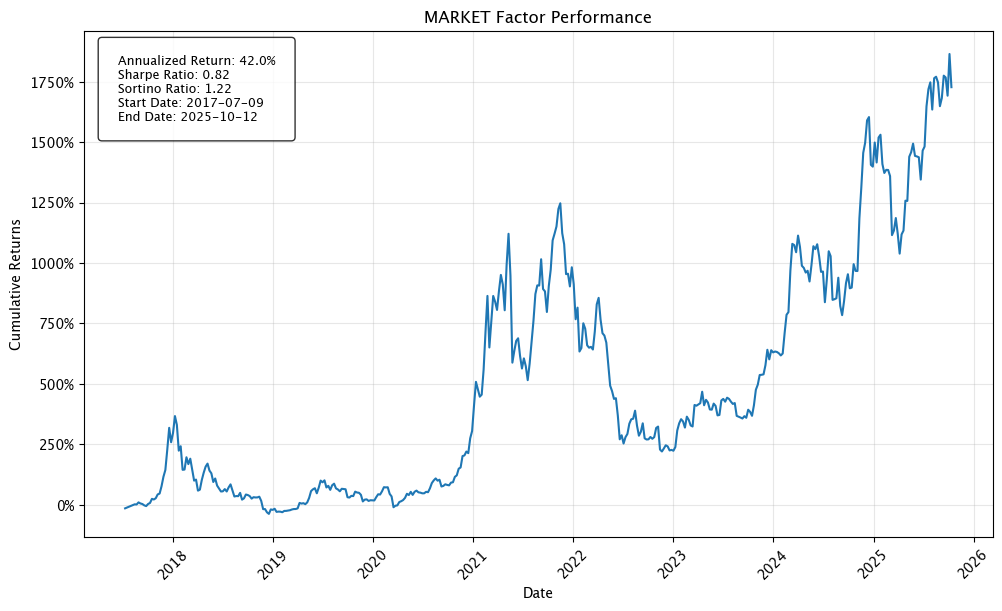
Factor Model: market Number of Assets: 10 Weighting Method: market_cap Annualized Return: 0.42 (42%) Cumulative Returns: 17.27 (1,727%) Years: 8.28
The Market Risk factor-mimicking portfolio is a long only portfolio constructed of the top 10 assets by market cap, and is market cap weighted. This factor behaves similarly to a crypto “market index,” and confirms the presence of a broad market risk premium that compensates investors for holding aggregate crypto exposure. Including the top 10 tokens is more reflective of broader crypto returns and is more inclusive, given Bitcoin and Ethereum dominance now stand at ~59% and ~13% respectively.
Tests whether small caps outperform large caps.
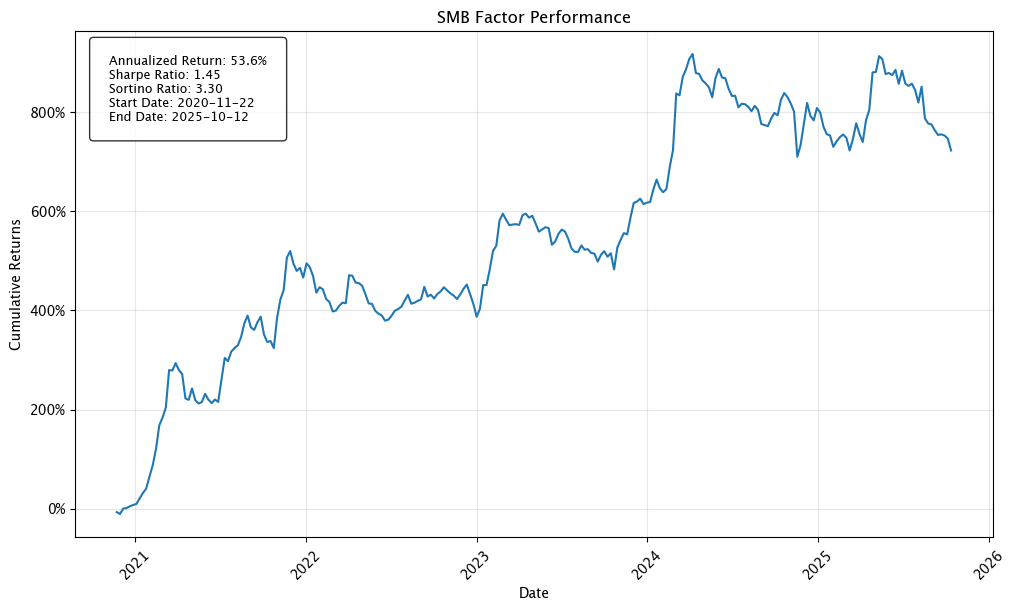
Factor Model: smb Breakpoint: 0.5 Min Assets: 40 Weighting Method: equal Annualized Return: 0.536 (53.6%) Cumulative Returns: 7.23 (723%) Years: 4.90
The Size (SMB) factor-mimicking portfolio is an equal weighted long-short portfolio that longs the smallest 50% of eligible assets per period and shorts the largest 50% of eligible assets per period. The minimum number of assets must be ≥ 40 (20 per leg). Equal weighting ensures that small-cap tokens contribute meaningfully despite lower market caps. The SMB spread exhibits higher volatility but persistent positive drift, implying investors demand additional compensation for small-cap liquidity and risk.
Tests whether cheap tokens outperform expensive tokens (value measured by mc_fees_ratio)
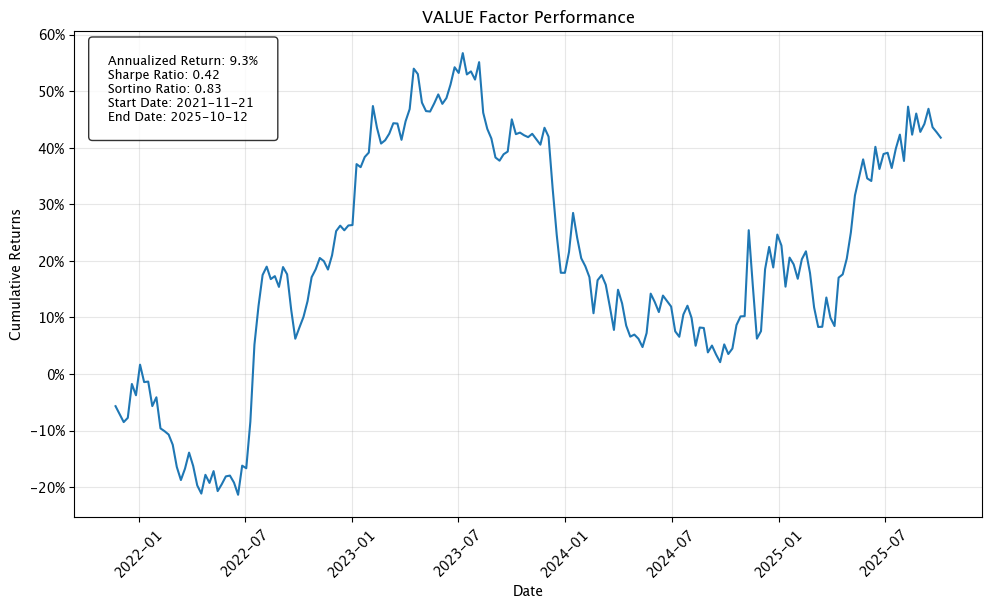
Factor Model: value Breakpoint: 0.5 Min Assets: 30 Weighting Method: equal Annualized Return: 0.093 (9.3%) Cumulative Returns: 0.41 (41%) Years: 3.91
The Value factor-mimicking portfolio is an equal weighted long-short portfolio that longs the 50% of assets with the highest value (lowest mc_fees_ratio) and shorts the 50% of assets with the lowest value (highest mc_fees_ratio). Due to less fee metric coverage, the minimum number of assets required per period is 30 (15 per leg). Value is proxied by the inverse of the market-cap-to-fees ratio, analogous to a P/S multiple.
Tests whether winners keep winning and losers keep losing.
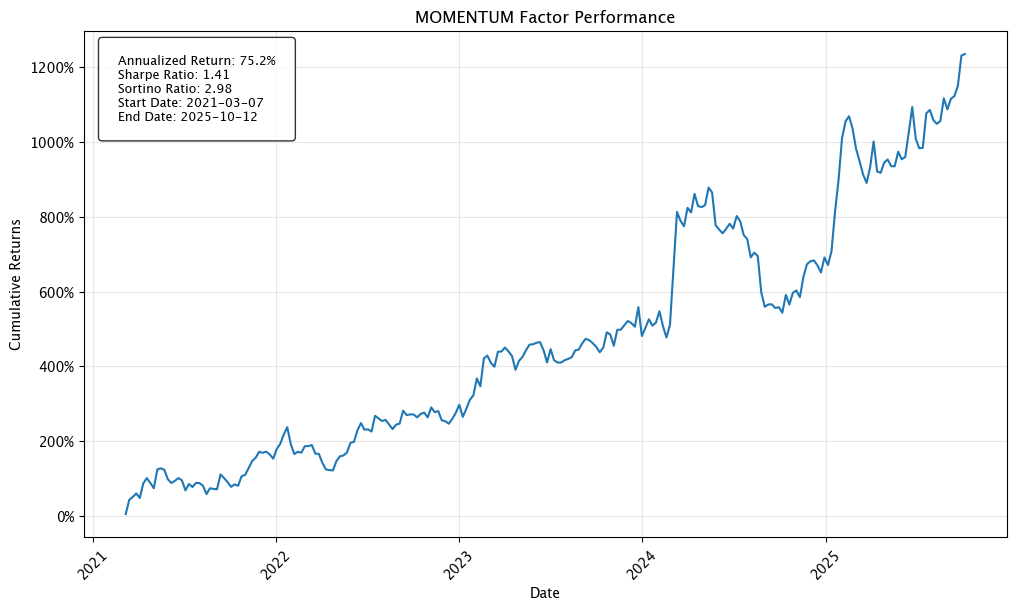
Factor Model: momentum Breakpoint: 0.25 Min Assets: 30 Weighting Method: equal Annualized Return: 0.75 (75%) Cumulative Returns: 12.35 (1,235%) Years: 4.62
Momentum is calculated using a 3-week, volatility-adjusted framework designed to capture consistent price trends rather than short-term spikes. Our momentum score rewards smoother price appreciation and discounts volatile paths. At each rebalancing date, assets are ranked by their T-1 momentum score, and the factor portfolio is constructed by going long the top 25% and short the bottom 25% of assets. This allows us to capture persistent, low-volatility momentum while avoiding lookahead bias.
Traditional style factors apply to crypto and explain an average of 55% of individual asset returns and 74.8% of diversified portfolio returns.
Market Factor:
Size Factor (SMB):
Value Factor:
Momentum Factor:
Factor Correlations:
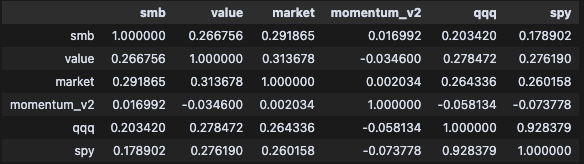
Low correlations between all factors, signifying they successfully capture different dimensions of risk and there is little cross-contamination between factors.
Portfolio Sorts Analysis:
I created 4 different portfolio’s sorting by size and value, to gauge whether our factors correctly model and explain the returns of each sort.
For each period, the portfolio’s are constructed as follows:
This results in the following portfolios:
Large Cap High Value
Large Cap Low Value
Small Cap High Value
Small Cap Low Value
Given the distinct characteristics of each portfolio, we would expect to see high factor loadings for the SMB factor on the small cap portfolio’s, and high factor loadings for value on the high value portfolio’s. We would expect to see the inverse for the large cap portfolio’s and low value portfolio’s respectively.
Results
TLDR: The factor models largely work as intended and the factor loadings reflect what we would expect for each portfolio.

Large Cap High Value:
Large Cap Low Value:
Small Cap High Value:
Small Cap Low Value:
*** p_value < .01
** p_value < .05
*p_value < .10
Sequential Analysis:
Market risk explains the majority of returns, then Size, and then Value. Each factor is valuable and explains an additional portion of return resulting in an overall better model.

Individual Asset Factor Loadings:
For each asset that satisfied the eligibility criteria in the most recent full rebalancing period and had mc_fees_ratio metric coverage, we regressed our factors onto that asset’s returns. There are 67 assets in total in this evaluation.
Results:
Number of assets: 67
Percent of assets where p-value for market is < 0.05: 100.0% Percent of assets where p-value for smb is < 0.05: 49.3% Percent of assets where p-value for value is < 0.05: 35.8% Percent of assets where p-value for momentum is < 0.05: 25.4%
Key Takeaways:
Written by ex-VCs at leading funds. Learn from leading digital asset investors.
.avif)